Kathleen Gustafson, PhD and Eleanor M. Kellon, VMD
The ECIR Group has improved the welfare of equines with metabolic disorder by focusing on prevention and treatment of Laminitis. The US alone has almost 10 million horses. The most current estimates are that 10% to 15% of horses will suffer from Laminitis every year, with 80% to 90% of the cases caused by endocrine disease. On average, that is 1 million horses per year in the US alone.
They recommend that Horses who cannot regulate insulin should not be grazing pasture. Owners should concern themselves with the insulin in the horse, not the fructan in the pasture.
This is ECIR Group review of an article which is largely based on the 2006 research dissertation of Dr. Bridgett McIntosh, entitled, “Circadian and Seasonal Variation in Pasture Nonstructural Carbohydrates and the Physiological Response of Grazing Horses”. The entire dissertation is publically available HERE This is an excellent resource.
First, a review of the terms used:
TOTAL NONSTRUCTURAL CARBOHYDRATES (NSC): NSC is the sum of fructans, sugars, and starch.
SUGAR: Sugars found in pasture (glucose, sucrose) are digested and induce a postprandial glycemic response (a rapid rise in glucose and insulin after eating). Fructose, also found in pasture has a significantly lower glycemic index and induces a minimal insulin response.
FRUCTANS: Fructans are plant storage carbohydrates, i.e., the carbohydrate that the plant stores and uses for fuel. Fructans cannot be digested by mammals. Instead, they are fermented by bacteria in the gut and yield less than half the calories of simple sugars. It is widely accepted that fructans do not induce a rapid increase in glucose and insulin because of their indigestible nature.
STARCH: A complex carbohydrate, starch is digested to glucose and, like sugar, causes a glycemic response.
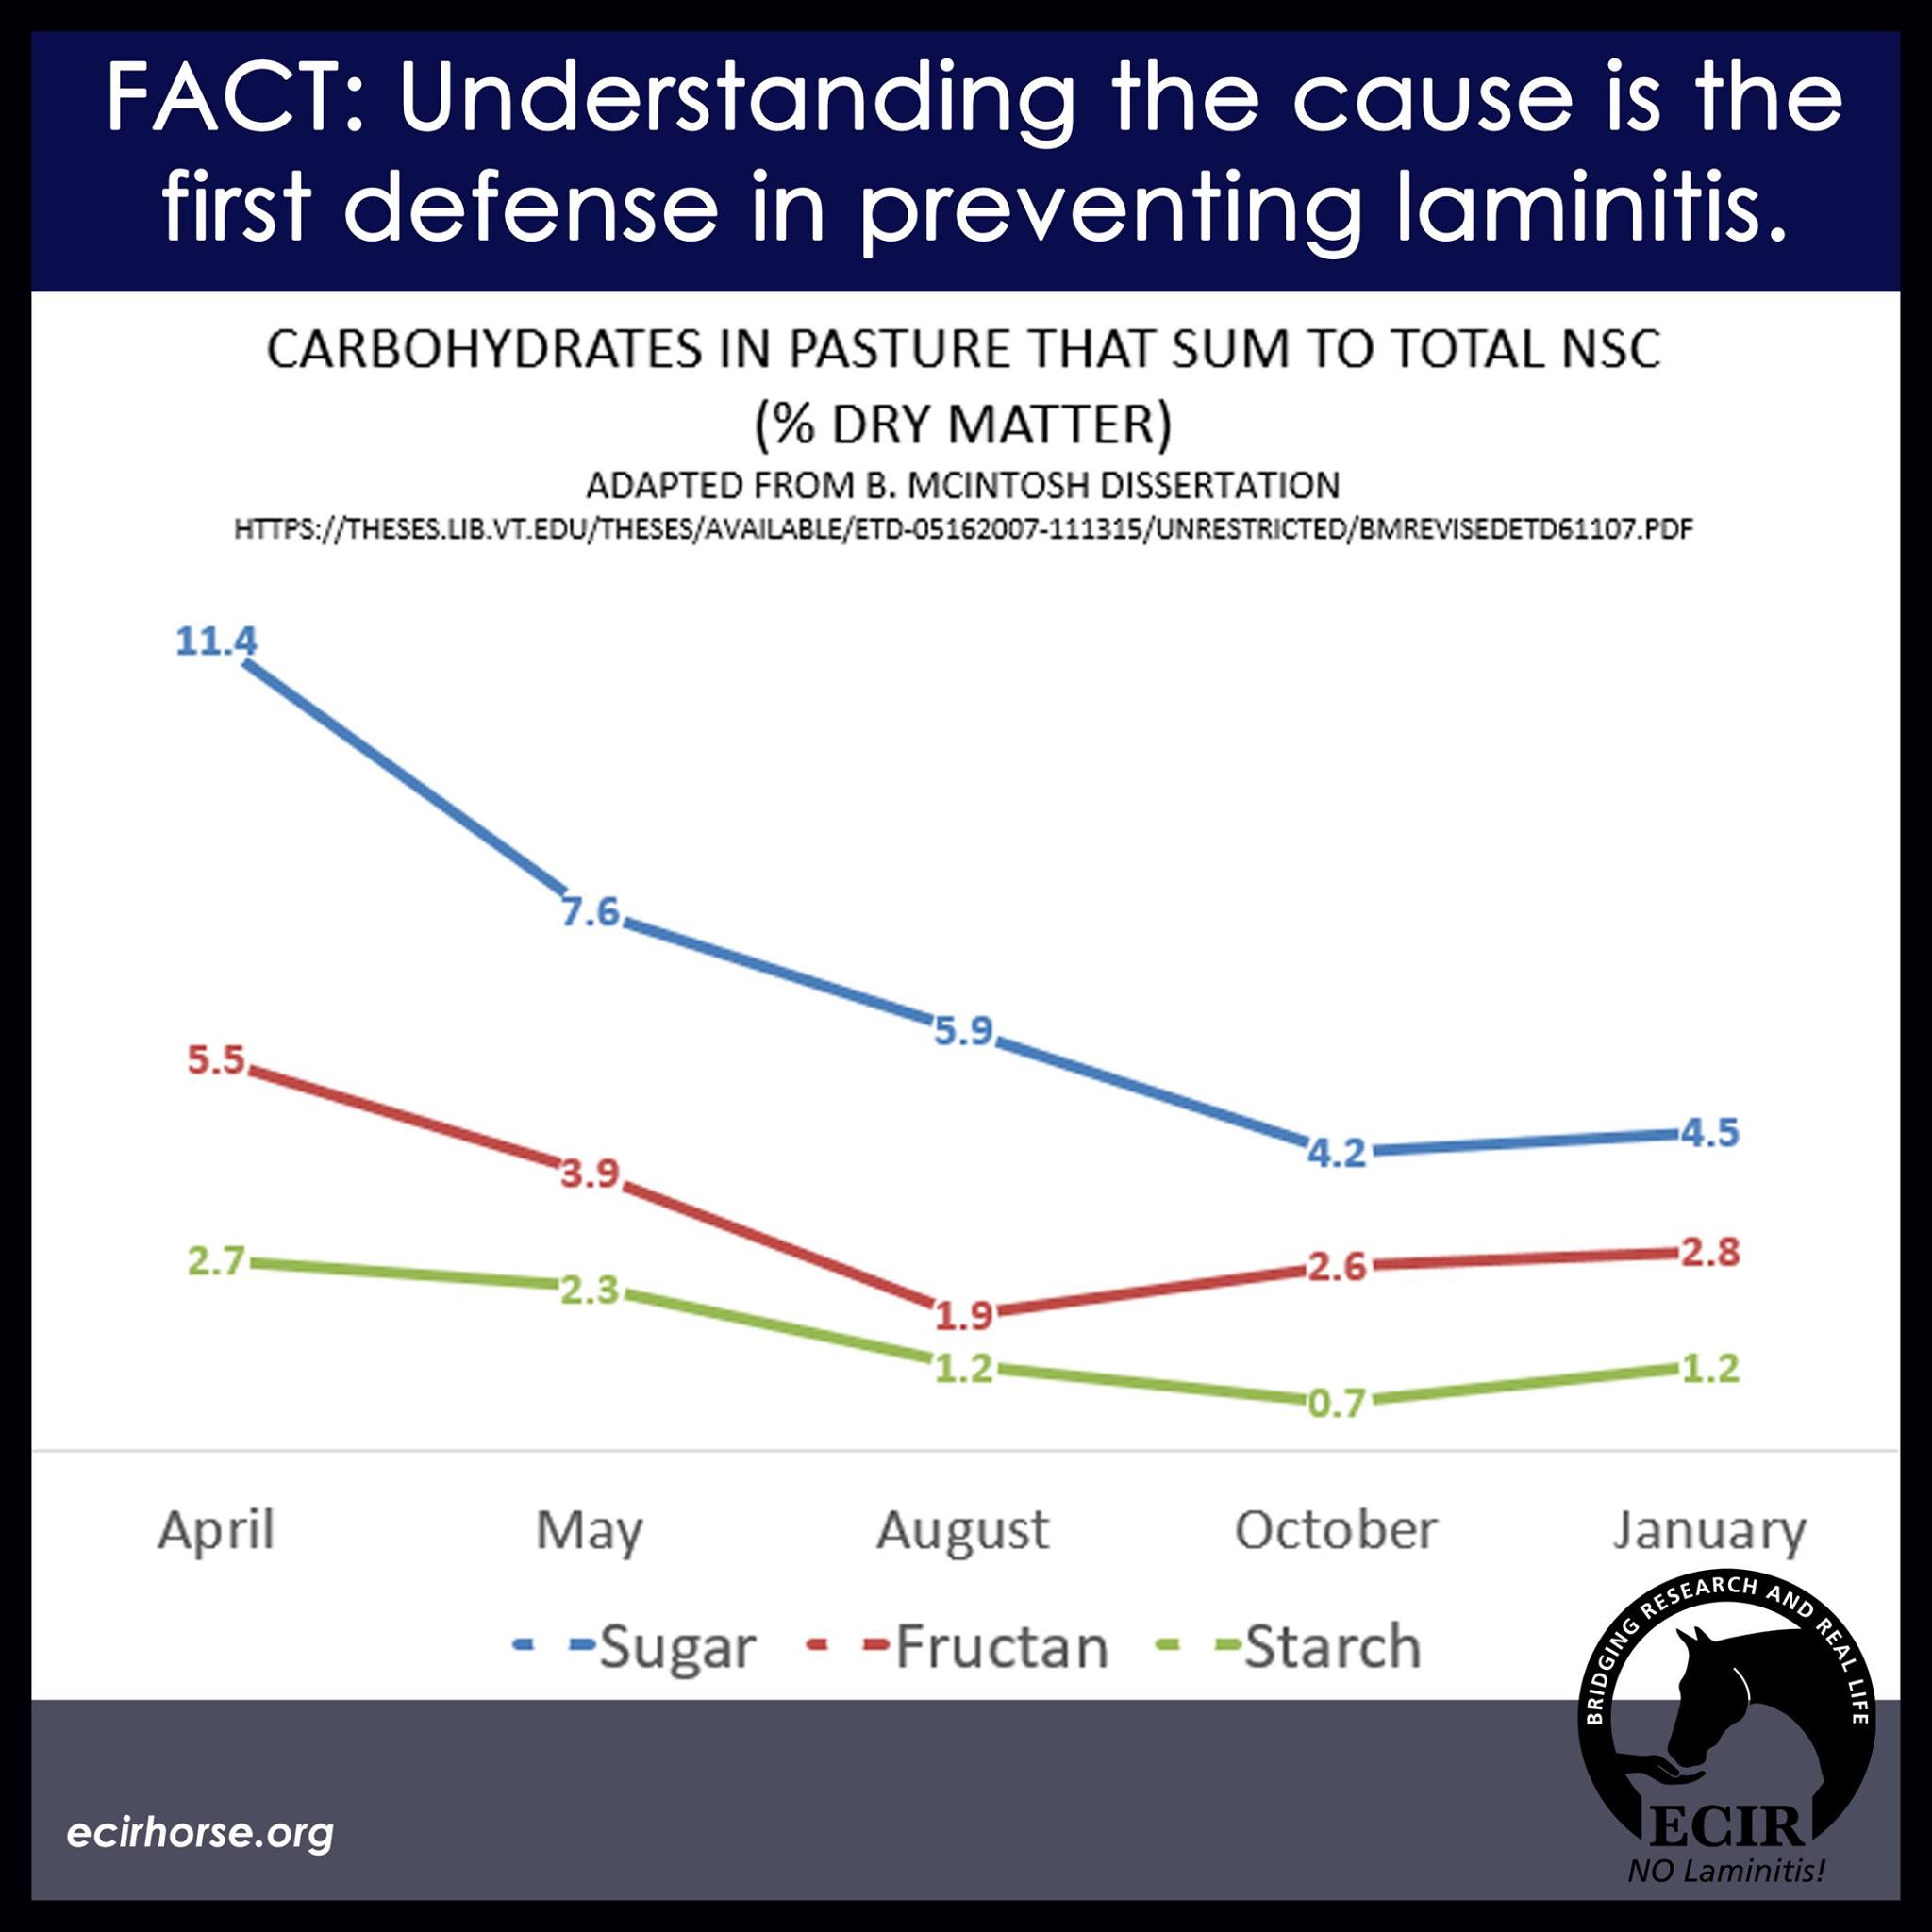
EXPERIMENTAL METHOD AND RESULTS: McIntosh collected pasture samples in April, May, August, October and January. She measured total NSC and equine glucose and insulin hourly. Total NSC was highest in April and May and showed a circadian rhythm, peaking in the late afternoon and early evening and was lowest in the early morning hours.
Equine glucose and insulin followed the rise and fall of NSC. Again, NSC is the sum of fructan, sugar, and starch. What is behind the rise and fall of NSC and the subsequent glycemic response in the horse? The answer is sugar.
The intent of the article is to warn of the danger of pasture in the springtime. The emphasis is on fructan; suggested to be the causal agent in pasture-associated laminitis. There is a comment that fructans “appear to cause increases in blood insulin” and a concern that pasture fructans may “…cause a response that is similar to what happens when starch reaches the hindgut; they trigger acid production, a drop in pH, and a chain-reaction that might result in laminitis.”
However, there is limited evidence that the fructans found in grass, consumed over the course of a day, will result in the severe GI upset and systemic illness described above. It is known that a massive bolus of 8 lbs or more of pure commercial chicory root fructan (inulin), pushed rapidly through a nasogastric tube will trigger the above scenario.
In contrast, there is less emphasis on pasture sugar. There is a paragraph accurately describing how simple sugar causes fluctuations in glucose and insulin and that elevated insulin causes laminitis. There is a comment that elevated glucose might also trigger laminitis.
However, it is known that hyperglycemia (elevated blood glucose) is a rare finding in equine insulin resistance (IR). To date, there is no evidence that hyperglycemia alone causes laminitis. The experiments showing that insulin alone caused laminitis were euglycemic (normal glucose). Hyperglycemic IR horses also have elevated insulin and any episode of hyperglycemia (e.g., postprandial) is always accompanied by a high insulin.
We have some objections to the article due to the emphasis on fructan instead of sugar. To support our position, we will refer to the data discussed in the article, from the McIntosh dissertation.
Of the total NSC, simple sugar made up the largest percentage, in excess of 50% of the total NSC in all months. In April, the month with the highest total NSC, average pasture sugar was 11.4%, fructan was 5.5% and starch was 2.7%. To put this into perspective, an average day of grazing would yield roughly 20 lbs of dry matter forage.
Using the April figures for carbohydrate content, this translates to 2.3 lbs of sugar, 1.1 lbs of fructan and one-half pound of starch. If you add the two carbohydrates that stimulate a glycemic response, that’s nearly 3 lbs of sugar plus starch vs. 1 lb of fructan. In order to overload the equine hindgut with enough fructan fiber to overwhelm the gut biota, research has shown that at least 8 lbs of chicory root fructan is needed. It must be pushed rapidly into the system, not grazed over the course of a day.
Using the April figure of 5.5% fructan, the horse would have to eat 146 lbs of forage dry matter to take in 8 lbs of fructan which, obviously, is impossible. Alternatively, if the horse consumed a normal amount for the day (2% of body weight dry matter, the grass would have to be 36.4% fructan dry matter to reach the 8 lbs of fructan known to induce endotoxemia.
Does fructan stimulate an insulin response? The only experiment that showed elevated insulin in a fructan overload model occurred when researchers mixed the fructan with a high-sugar product. (Bailey et al., 2007). Given the glycemic response properties of sugar and indigestible nature of fructan, the high-sugar product likely contributed to the elevated insulin in this experiment. Later studies using inulin fructan without a high-sugar product did not result in elevated insulin (Borer et al., 2012).
The article states that “…daily fluctuation in pasture NSC also influences blood glucose and insulin.” This is supported by the data. On page 48 of the dissertation, there is an elegant graph that shows how total NSC fluctuates during the day, ranging from roughly 18 to 28% in April.
Since NSC is a sum, we need to know which carbohydrate component is driving this fluctuation. (This is our objection to using total NSC – it doesn’t get to what is actually driving hyperinsulinemia, the actual mechanism behind laminitis from grazing pasture.)
On page 49, it becomes clear that sugar is the only carbohydrate component driving the rise and fall of total NSC. In April, sugar ranges from 16 to 24%. The results of the statistical analysis of the total NSC and sugar are virtually identical, confirming that the carbohydrate fluctuations and mirrored fluctuations in equine glucose and insulin are due to SUGAR.
It has also been established that there is a linear relationship between insulin and Obel grade of laminitis; the higher the insulin, the worse the laminitis (Walsh et al., 2009)
On page 50, note that fructan, ranging from 4-6% does not show the same daily, sunlight-dependent fluctuation. Neither does starch (see confirmation on page 28). Total NSC, sugar and equine glucose and insulin mirror each other in all months. Sugar is driving the ups and downs of NSC and the glycemic response in the horse.
Nonetheless, it is important to add that while starch was not a major factor in these grasses, it was a spike in clover starch that caused high insulins and laminitis in the IR ponies in a field study of naturally occurring pasture laminitis in Virginia. (Treiber et al., 2006)
We’re not sure why there is so much continued emphasis on fructans, hind gut acidosis, and endotoxemia leading to laminitis. If fructans were responsible for pasture-associated laminitis, then ALL horses, not just those who cannot regulate insulin, would be susceptible.
Furthermore, there would be many reports of horses presenting with colic symptoms, fever, explosive diarrhea, and severe systemic illness that ultimately leads to laminitis. That’s not to say that these cases don’t exist. There may be horses that are uniquely sensitive to fructans, e.g., horses already getting excessive amounts of grain and turned out on a high-fructan pasture found in other parts of the world.
The majority of pasture-associated laminitis cases present slowly, often with a classic IR phenotype – cresty neck, lumpy fat deposits, pendulous sheath/udder, tender footedness, and lethargy – that eventually develops into full blown laminitis from hyperinsulinemia.
In conclusion, the data clearly show that:
1. In this study of North American Virginia pasture, sugar was the primary carbohydrate in pasture, making up over 50% of total NSC in all months tested, highest in April and May.
2. Sugar levels rise and fall with sunlight;
3. When grazing, equine glucose and insulin rise and fall corresponding to pasture sugar levels;
4. Fructan is not sugar, and does not show a circadian rhythm;
5. Horses who cannot regulate insulin should not be grazing pasture;
6. Owners should concern themselves with the insulin in the horse, not the fructan in the pasture.
Some may say that this doesn’t matter, that lumping all of the carbohydrates into NSC is good enough. The ECIR group cares about these details because, in order to understand the management of any condition, you must understand the mechanism.
Controlling insulin in the IR horse means controlling sugar, not fructan. As stated in the article, efforts to “monitor fructan intake” are not only difficult, they are distracting, potentially harmful, and add to the burden of caretakers. The sooner the focus is on the carbohydrates that induce hyperinsulinemia, the sooner horse owners will understand how to avoid laminitis in susceptible horses.
About the ECIR Group - NO LAMINTIS
Started in 1999, the ECIR Group is the largest field-trial database for Pituitary Pars Intermedia Dysfunction (PPID) and Insulin Resistance (IR) in the world, and provides the latest research, diagnosis, and treatment information, including dietary recommendations, for horses with these conditions. The approach to help maintain optimum equine health is the Diagnosis, Diet, Trim and Exercise (DDT/E) Protocol.
The US alone has almost 10 million horses.
The most current estimates are that 10% to 15% of horses will suffer from laminitis every year, with 80% to 90% of the cases caused by endocrine disease. On average, that is 1 million horses per year in the US alone.
While it can be a death sentence if not diagnosed and managed correctly, prevention and rehabilitation can be achieved.
Since 1999, the ECIR Group has improved the welfare of equines with metabolic disorder by focusing on prevention and treatment of endocrinopathic laminitis. Helping caregivers learn to recognize the importance of diagnosis, diet, trim, and exercise has seen thousands through the complications of Equine Cushing's Disease and Insulin Resistance.
Are you interested in promoting your business or sharing content on EIE? Contact us at info@equineinfoexchange.com


